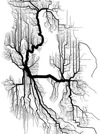
Data visualization: stories for the Information Age
“For artists and designers, data visualization is a new frontier of self-expression, powered by the proliferation of information and the evolution of available tools. For enterprise, it’s a platform for showcasing products and services in the context of the cultural interaction that surrounds them, reflecting consumers’ increasing demand for corporate transparency.” […]
“Data visualization is a way to make sense of the ever-increasing stream of information with which we’re bombarded and provides a creative antidote to the “analysis paralysis” that can result from the burden of processing such a large volume of information.” […]
“Ultimately, data visualization is more than complex software or the prettying up of spreadsheets. It’s not innovation for the sake of innovation. It’s about the most ancient of social rituals: storytelling. It’s about telling the story locked in the data differently, more engagingly, in a way that draws us in, makes our eyes open a little wider and our jaw drop ever so slightly. And as we process it, it can sometimes change our perspective altogether. “
(Make sure to check out the excellent slide show.)


